There is something more strange than a simple inflation occurring. Here is the updated graph of the average of the players ranked 11 to 50, as I showed previously, but now to Sept. 2016.
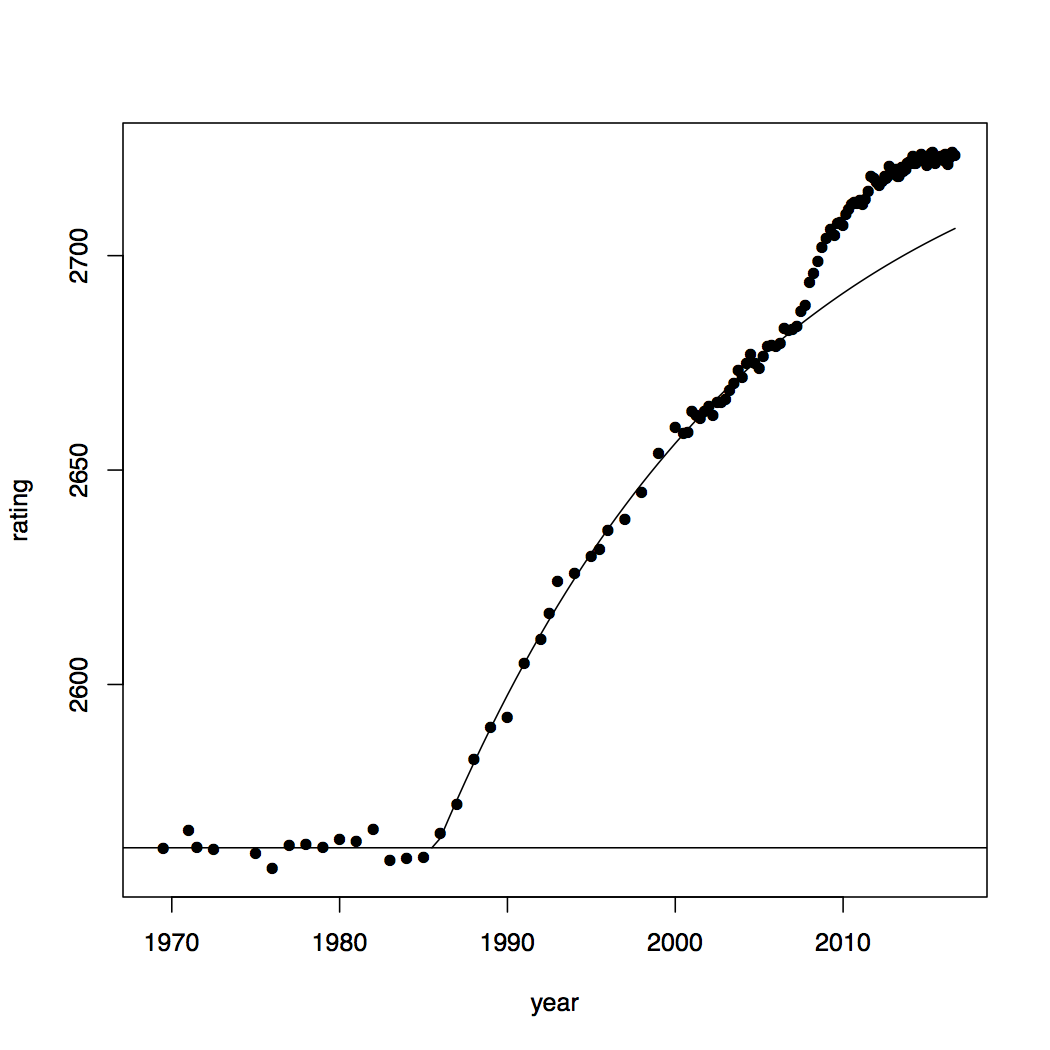
There appears to be a flattening in recent months. However, if we look at the average of the players ranked 51 to 100, we see something else.

Since mid-2012, this average has actually been dropping and the turn-around seems quite sharp.
To investigate further, I looked at the histograms of the entire list of Elo ratings at several time points. Here they are for the 1 Jan. 2000 list, the 1 Jan. 2008 list, the 1 Jan. 2011 list, and the 1 Jan. 2016 list.
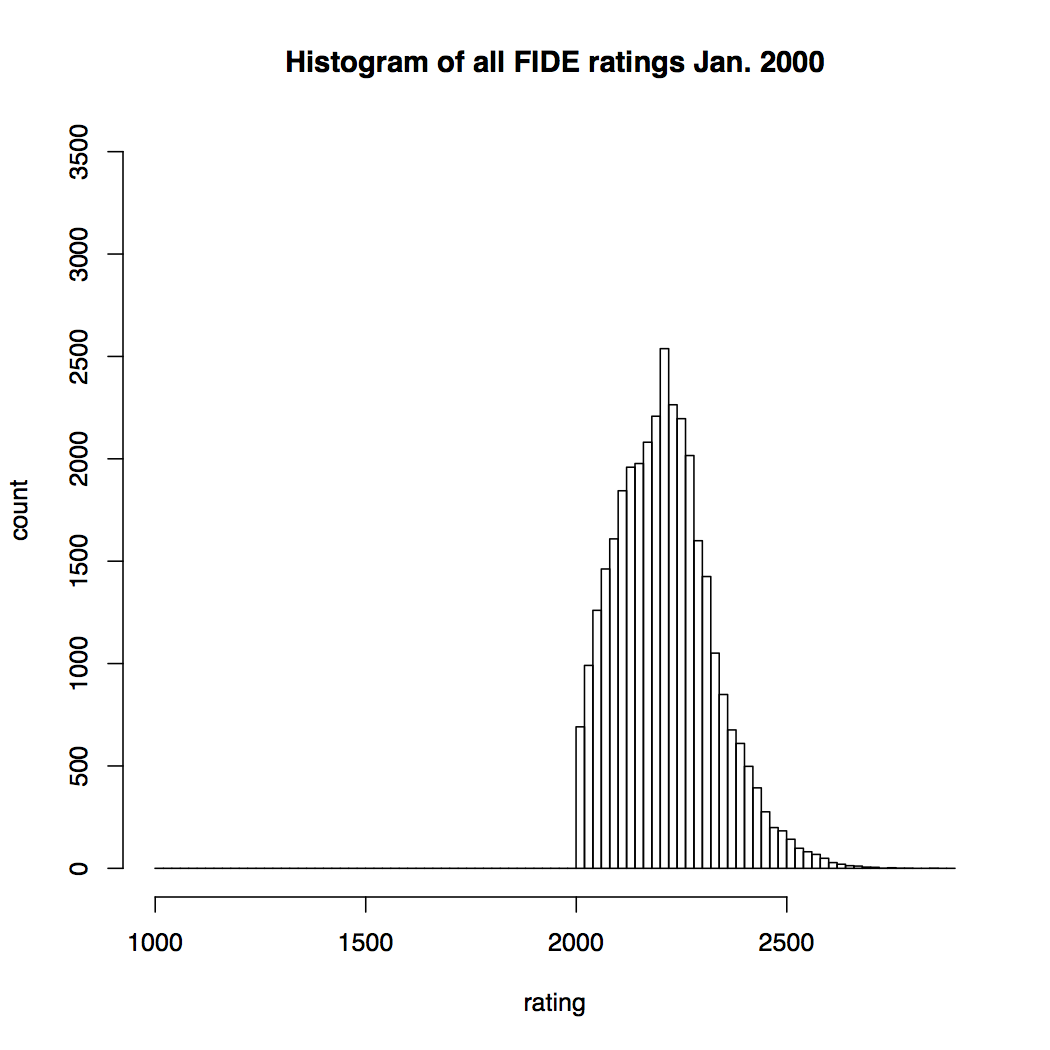
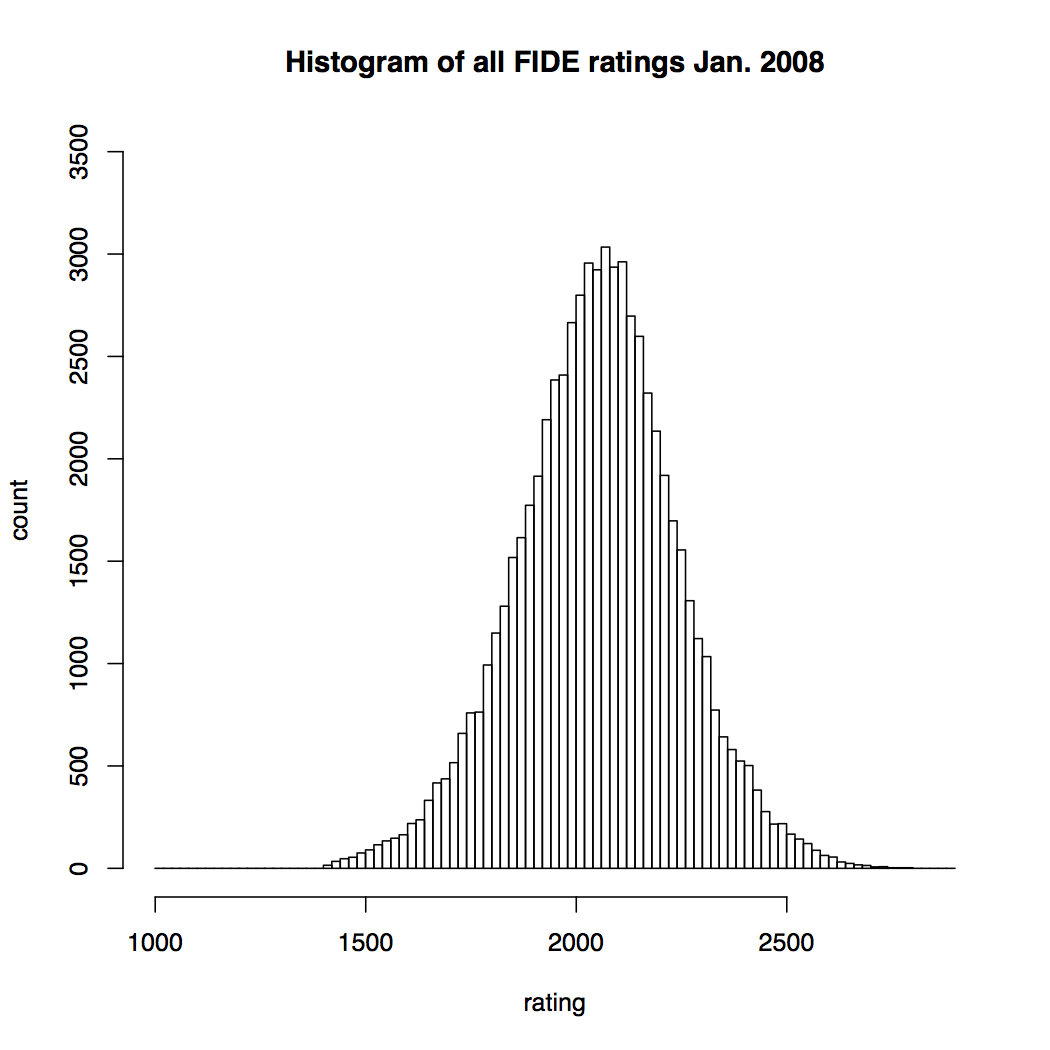
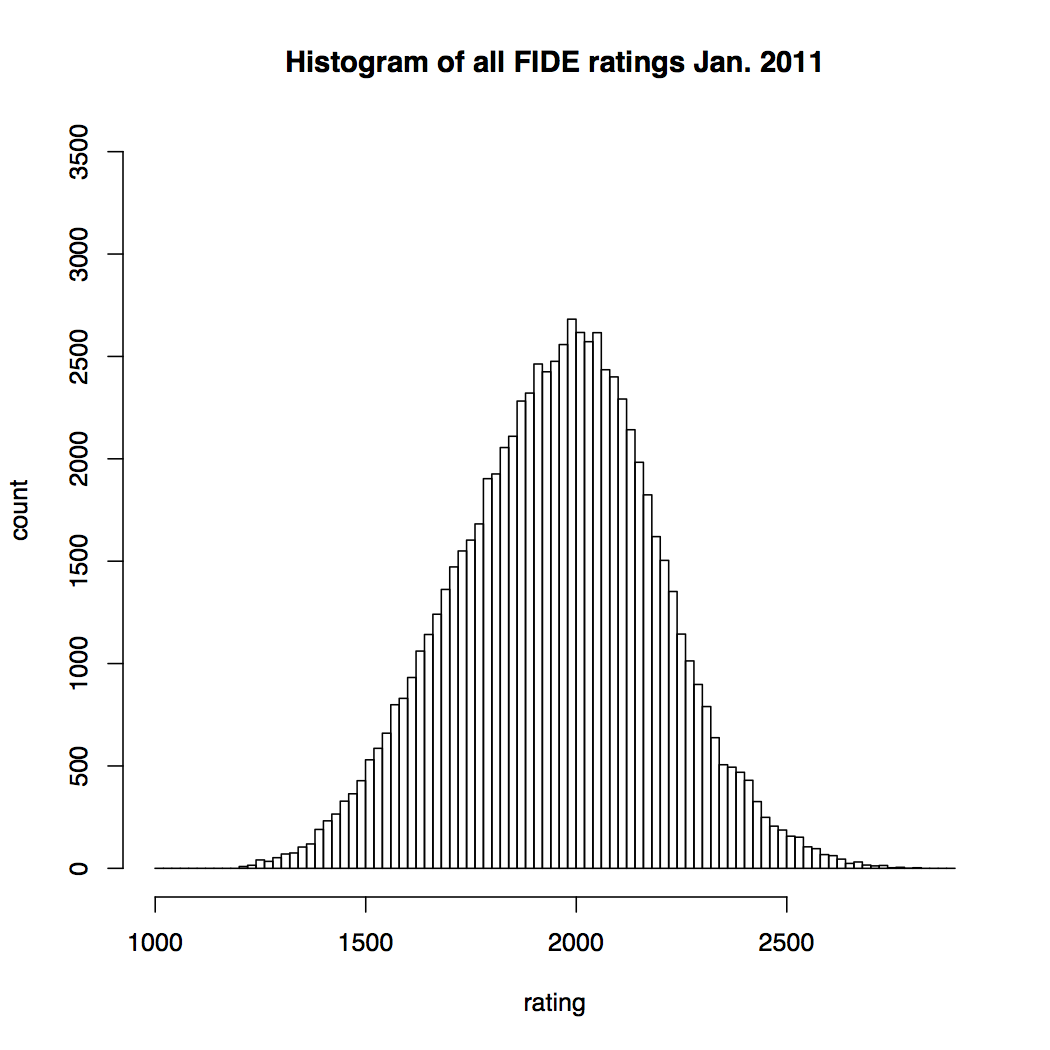
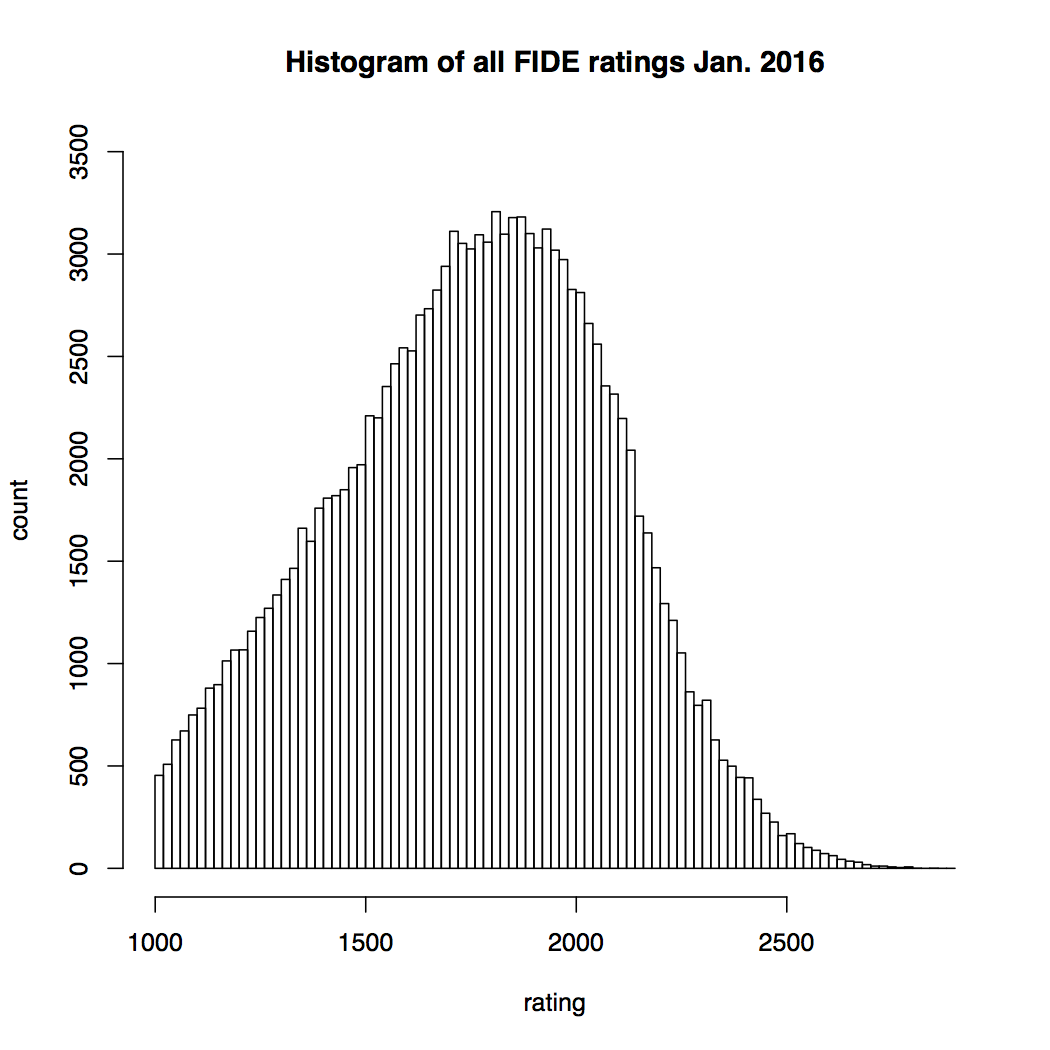
Each bar in these histograms counts the number of players in a bin of width 20 - for example, players rated between 2200 and 2219 are in one bin, 2220 to 2239 in the next, and so on. It is easy to see how the rating floor of the FIDE ratings has been decreasing over the years. In Jan. 2000, only players rated 2000 or above were included, while by Jan. 2016, players 1000 and above are rated. It's also easy to see the overall large increase in the total numbers of rated players. There are subtler shifts though. Here are the first three of these histograms plotted again as line graphs, on top of each other, so we can compare them.
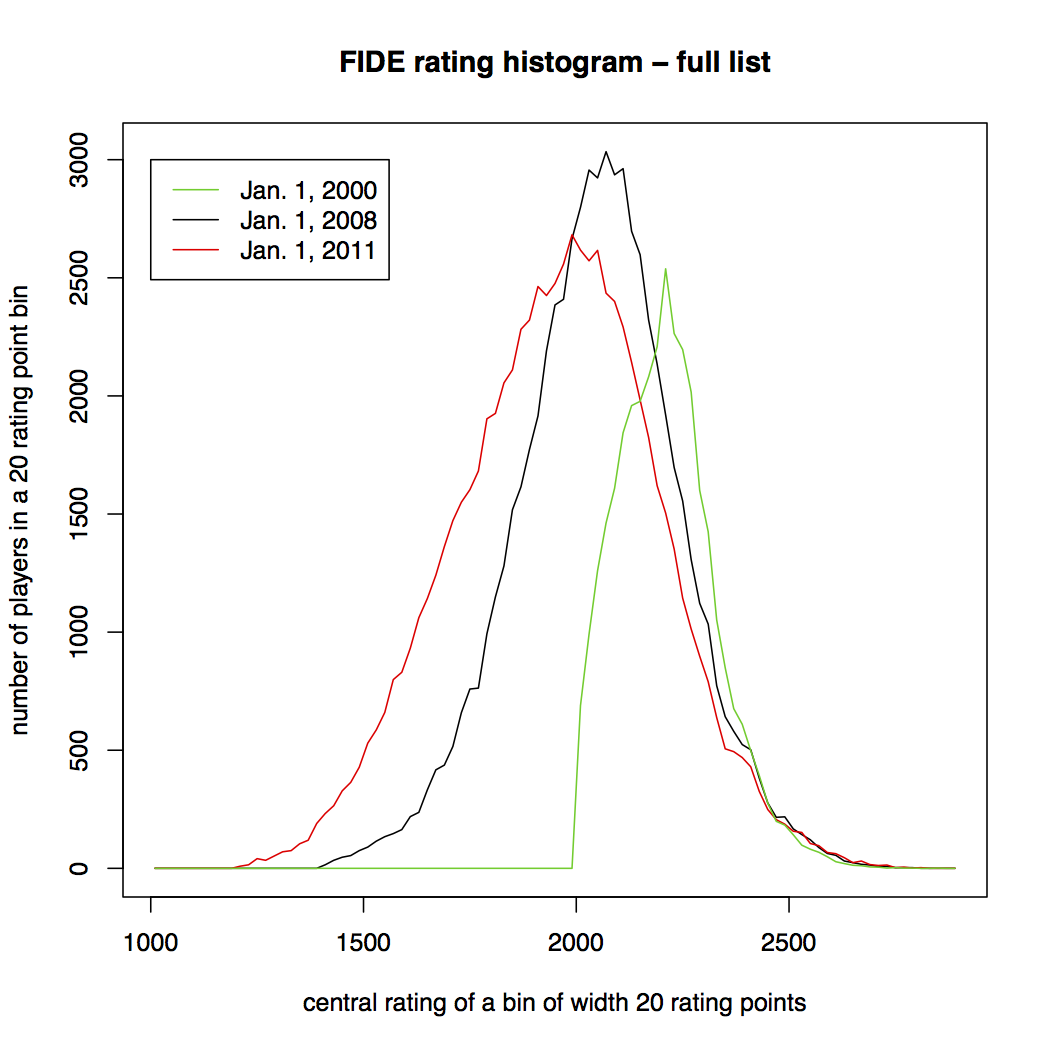
The shift of the left edge of the distribution of ratings to the left over time is clear. However, note that much of the right edge is shifting to the left also. It is strange that, despite the large increase in overall number of rated players over time, there are more players between about 2180 and 2400 in Jan. 2000 than there are in Jan. 2008, and more players between about 2000 and 2520 in Jan. 2008 than in Jan. 2011. The entire distribution is changing shape. But what about the top end. It is hard to see in the graph above, but easier to see if we plot the vertical axis (number of players in each bin) on a logarithmic scale.

Here, it is clear that at the higher ratings, above about 2500, the numbers are increasing over time, at least up to the year 2011. Beyond mid-2012, as noted at the top of this page, the beginning of a decline near the top (say over a rating of 2650) is evident --- whether measured by average rating of players in some range of ranks (like 51 to 100), or by number of players in a rating range (like 2650 to 2700).
The causes of these shifts in the overall distribution of FIDE ratings is not at all clear to me. A massive increase in the numbers of lower-rated players included in the rating system seems to have occured at the same time as a general widening of the rating distribution, and perhaps a slight downward shift, except at the very top, which has continued to increase until very recently, but perhaps not in the future.


